I spent last weekend trying to make an app using ArcGIS Online and I would like to tell you my story. Starting from scratch, I wanted to create a map to show the rate of crime in the U.S related to the unemployment rate in 2012, based on FBI data. So, I downloaded all related data from official sites.
My first obstacle was managing tables. I used the join tool to integrate data, but this process turned out to be a little cumbersome. First, I installed LibreOffice, since it’s easy to use and open source. In order to make a successful join, I saved my tables in .xls format and, more importantly, I made sure that I had a common attribute field between the tables and the layers I wanted to integrate. It’s better to use a simple field such as the state code or a column with numbers from 1 to X, and always make sure that the type of field is the same in both table and layer.
These are the steps I followed after finding data and joining the tables:
-
I created a layer (shapefile) per each type of crime selected, clicking on the layers: data > export data> this layer’s source data and finally adding the exported layer to my map.
-
I added symbols to every layer using: layer properties > symbology.
-
I labelled the layers using: layer properties > labels > placement properties and a specific scale rage.
-
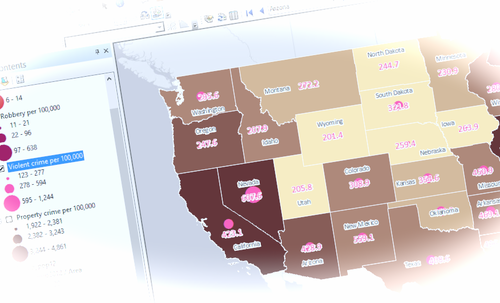
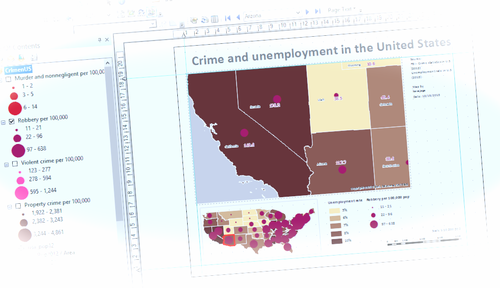
I added a base map using ArcGis Online, just by clicking on the upper bar Add data > add basemap and choosing my favorite one. These maps below were my result:
Violent crime per 100,000 pop in the U.S:
Murder per 100,000 pop in the U.S:
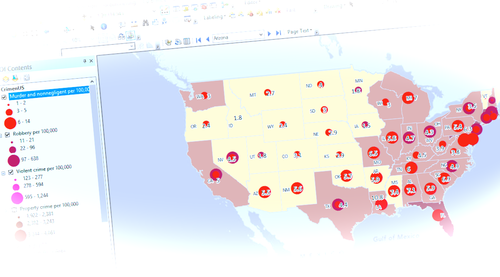
Robbery per 100,000 pop in the U.S:
But the important issue was to create an app in ArGIS Online, so I took the steps below:
-
created a business account in ArcGIS Online (30 day free trial)
-
signed in ArcGIS Desktop with this account to publish the layers as “service”
-
in ArcGIS Desktop, selected File > share as a “Service”> publish a service > my hosted services > capabilities > feature access > descriptions (completed information) > sharing (everyone) > analyze and publish
In ArcGIS Online:
-
decided what to show, so selected my map > add > search for layers > add
-
clicked on save > title (completed information) > tags (completed information) > save map
-
clicked on share > chose the application and configured it
After this careful process, I found out I couldn’t publish my map (maybe because the layers weighed too much or the polygons chosen had too many vertices). So after a little frustration, I decided to create an easier map to show Hispanics and Asians in the U.S.
I’m happy with the result, but I’ve learnt from this first try that It’s better to never give up and try to choose an easier path in your learning process. I’m pretty sure that in the short term I will find a way to publish the first map I intended to make.
In the mean time I want to thank my partner @lorenzoplanas with his unconditional support and encouragement, because “there is no gain without pain”.