The Story of James Rodriguez
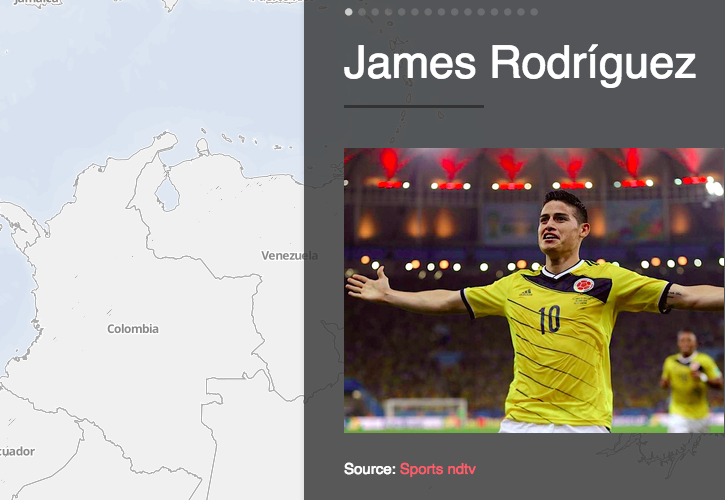
After the World Cup and having become a soccer fan, I thought it would be a great opportunity to combine my love for maps with my Colombian roots. For this project I chose CartoDB, a cloud platform that lets users build map applications in a very easy way. Their new open-source tool named Odyssey.js let me create “The story of James Rodriguez”.
The is no gain without pain with GIS

I spent last weekend trying to make an app using ArcGIS Online and I would like to tell you my story. Starting from scratch, I wanted to create a map to show the rate of crime in the U.S related to the unemployment rate in 2012, based on FBI data. So, I downloaded all related data from official sites.
Making a good start in GIS

Last week I started the Master GIS at Esri Spain. This is a great challenge, I feel this will change the way I work and how I see the world.